
The dashboard nobody opens
Built for launch day. Forgotten once the business moves on.
Data experiences by design. Executive dashboards and analytical systems crafted with hierarchy, restraint, and pixel-perfect precision.
Why analytics fail
Not because teams lack data, tools, or ambition. Dashboards, applications, workflows, and analytics assets become disconnected interfaces nobody revisits.
Built for launch day. Forgotten once the business moves on.
Data exists, but decisions happen outside the systems meant to support them.
Reports and apps were present. Clarity and alignment were not.
Meet Viora
Three pillars shape how Viora builds analytics, applications, and reporting as one coherent practice.
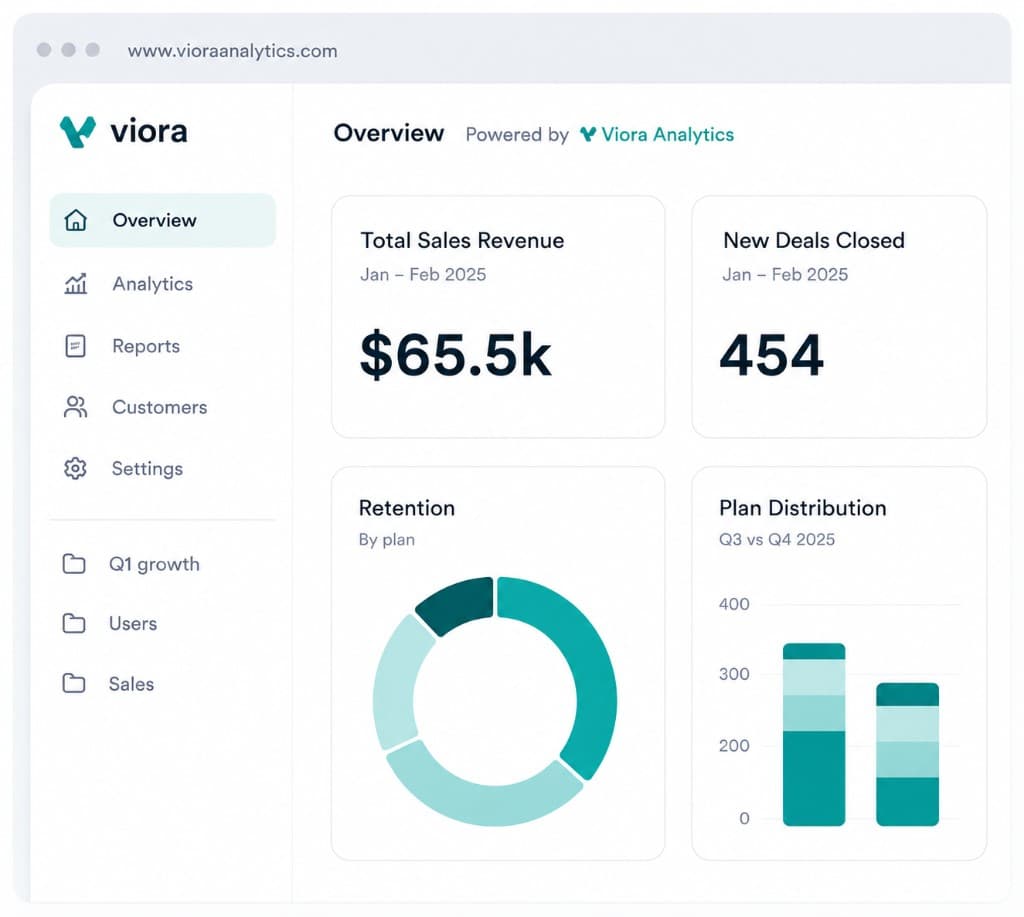
Executive overview
Metrics shaped for fast interpretation.
Shaped for how teams read, decide, and act.
Builds track goals leadership can see and trust.
Built for adoption, governance, and daily use.
Designed reports
Executive dashboards, semantic models, and data experiences built to be read, trusted, and reused.
Board-ready BI designed around hierarchy, narrative flow, and the decisions your leaders make.
Digital operations
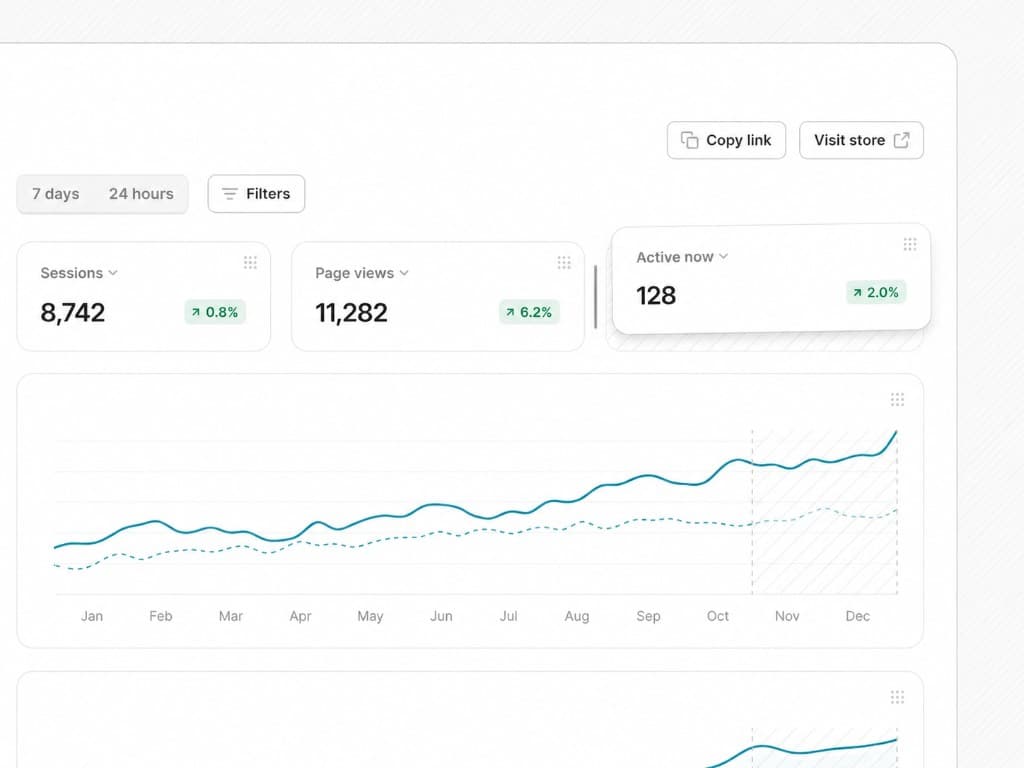
Power Apps, automation, and code-first interfaces that digitalize how teams operate day to day.
End-to-end process design that replaces manual steps with connected, governable experiences.
Capabilities
Executive dashboard design, Microsoft platforms, custom visuals, and governance: nine services built as one coherent analytical practice.
Board-ready reporting designed for fast interpretation and confident decisions.
Refresh existing BI assets with clearer hierarchy, narrative flow, and visual discipline.
Reusable reporting standards for typography, color, layout, and component patterns that scale.
Power Apps canvas and code: operational interfaces aligned with how teams actually work.
Lakehouse, pipelines, and semantic layers built as analytics infrastructure designed to stay governable.
Cloud data platforms, integration, and deployment patterns for reliable analytical delivery.
Bespoke Power BI visuals with HTML, CSS, and TypeScript for interactions beyond the defaults.
Structured exploration before build: flows, layouts, and prototypes stakeholders can react to.
Metadata, lineage, and standards so reporting stays understandable after launch day.

Positioning
Power BI and semantic models are tools. What matters is whether people understand, trust, and use what gets built.
Our Tech Stack
We work with the Microsoft ecosystem to power secure, scalable analytics, from semantic models to executive dashboards.
Yes. Power BI, Fabric, Power Apps, and Azure are the core stack. The practice goes deep on Power Platform rather than spreading across tools.
A short discovery call to understand context and constraints. Scope and deliverables are defined in writing before work starts.
Executive dashboards, semantic models, Power Apps interfaces, design systems, and documentation as one coherent reporting practice.
Project-based for defined outcomes, or retainer for ongoing stewardship. Scope is defined after a short discovery conversation.